
⚡ TL;DR
- →Most breakout signals in crypto are noise: price pokes through a level on thin volume and round-trips within days. Buyers who chase them pay the fees and the drawdown.
- →We built Trend Ignition: a 20-bar-high breakout that must also pass an efficiency-ratio filter (the path into the breakout was directional, not choppy) and a relative-volume filter (short-term volume at least 20% above normal).
- →The full formula is five lines of the same DSL our backtester runs, so you can scan it across every coin walk-forward — in-sample vs out-of-sample — and see for yourself where it generalizes.
- →The honest lesson from testing: the filter does not make breakouts magic. It makes them rarer and more honest — fewer trades, higher average quality, and a scan table you can actually read as a buy-side shortlist.
The Problem: Why Breakouts Betray Crypto Buyers
Ask any crypto buyer what hurts most and the answer is rarely "I missed the move." It is "I bought the breakout and it dumped." The breakout is the most seductive signal in trading — it looks like confirmation, feels like joining a winner, and arrives with a clean story: new high, new demand.
The problem is what a "20-day high" actually measures. It measures price only. It cannot tell the difference between:
A real ignition
Price ground higher in a directional path, volume expanded as new participants arrived, and the push through the high came with genuine follow-through demand behind it.
A low-quality pump
Price chopped sideways for days, then a thin-liquidity spurt — sometimes one candle on a low-liquidity alt — poked through the level. Nobody followed. It round-tripped.
Both print the same breakout event. Classic tools — Donchian channels, Bollinger breakouts, MA crosses — treat them identically. That asymmetry is precisely where retail buyers lose: the failed breakout is common, cheap to produce, and heavily marketed ("$XYZ breaks key resistance!").
So we set out to design an indicator that answers one question before you buy: does this breakout deserve your money?
🧩 The Design: Three Independent Axes of Conviction
The core design principle: a breakout is only trustworthy when it is confirmed on axes that a single candle cannot fake. Price is one axis. We added two more that are structurally harder to manipulate — the shape of the path and real participation.
1. The event axis — 20-bar-high breakout
The trigger stays deliberately simple and classic: the close crosses above the prior 20-bar highest high. Using REF(HHV(H,20),1) — yesterday's channel, not today's — matters: the level is fixed before the breakout bar, so the event is well-defined and cannot trigger off its own high.
Why keep the trigger classic? Because we are not trying to invent a new event. We are trying to filter a well-studied one, so any improvement is attributable to the filter, not to a novel trigger nobody has validated.
2. The path axis — Efficiency Ratio (ER)
Kaufman's Efficiency Ratio measures trend quality: the net 20-bar move divided by the sum of all bar-to-bar moves it took to get there.
ER = ABS(C − REF(C,20)) / SUM(ABS(C − REF(C,1)),20)
ER near 1 means price traveled in nearly a straight line — a directional path. ER near 0 means price lurched up and down to arrive nowhere — chop. A breakout emerging from chop is statistically a range extreme, not a trend start. A breakout riding an efficient path is a continuation of something already working.
Trend Ignition requires ER > 0.3: the net move must account for at least 30% of all the movement. This single check eliminates most breakouts born out of sideways noise.
3. The participation axis — Relative Volume (RV)
Volume is the only input on a price chart that is not price. A genuine breakout attracts participation; a fakeout happens on absence. We compare fast volume to slow volume:
RV = MA(V,5) / MA(V,20) → require RV > 1.2
Requiring the 5-bar average to be at least 20% above the 20-bar norm filters for sustained expansion, not a single spike candle (which on small alts is often one wash-trade print). It also proxies the thing a buyer silently needs most: exit liquidity. You can only sell a breakout position into real participation.
Why 1.2 and not 1.5 or 2? We first shipped 1.5 — it looked rigorous and backtested cleanly — and then ran it over 1,000 daily bars of BTC, ETH and SOL: zero entries, on all three. A filter that never fires is not conservative, it is dead. 1.2 still demands genuine expansion (five full bars averaging 20% above normal) while producing a trade every few months per coin — rare enough to be selective, frequent enough to mean something. It is a starting point, not gospel — the formula is editable.
📜 The Formula
The whole indicator is five lines of our indicator DSL — the same language the Indicator Lab, Strategy Backtester and Multi-Coin Scanner execute in your browser via the WASM engine:
ER:ABS(C-REF(C,20))/SUM(ABS(C-REF(C,1)),20),color=#54a0ff;
RV:MA(V,5)/MA(V,20),color=#f0b90b;
CV:STD(C,20)/MA(C,20),color=#ff6b81;
ENTRY:CROSS(C,REF(HHV(H,20),1)) && RV>1.2 && ER>0.3;
EXIT:CROSS(MA(C,20),C) || C<REF(LLV(L,10),1);
Line by line:
- →ER — the efficiency ratio, drawn as a sub-chart so you can see path quality evolve.
- →RV — relative volume; 1.0 is "normal", values above 1.2 mark expansion regimes.
- →CV — the coefficient of variation (20-bar STD / 20-bar MA). Not part of the entry logic; we draw it because a low CV into a breakout is the classic volatility-squeeze setup, and it makes the chart readable.
- →ENTRY — all three axes must be true on the same closed bar: close crosses above yesterday's 20-bar high and RV > 1.2 and ER > 0.3. The AND is the entire point — one candle can fake price, not all three.
- →EXIT — a dual stop: close back below the 20-bar moving average (trend invalidated) or below the prior 10-bar low (a fast Turtle-style trailing stop). Whichever hits first.
No hidden state, no proprietary black box — every parameter is visible and editable in the scanner or backtester. If you believe crypto's volume data is untrustworthy on a given exchange, delete the RV clause and rescan. The tool is a starting hypothesis, not a locked product.
🔬 The Validation: Walk-Forward, Across Every Coin
Designing an indicator is easy; not lying to yourself about it is the hard part. The classic trap is tuning parameters on the same history you score them on — every filter looks brilliant in-sample. So Trend Ignition was validated the way our Multi-Coin Scanner validates everything: walk-forward.
Each coin's candles are split 70/30. The in-sample segment is where the edge "would have been discovered"; the out-of-sample segment is scored blind, after the split, as if you had funded the account that day. The scan then ranks every coin by out-of-sample Sharpe and reports how many coins stayed profitable on data the parameters never touched.
What we looked for, and what you should look for on the live scan page:
- →Breadth over stars. One coin with a spectacular OOS Sharpe is luck. A majority of coins staying profitable OOS is a market behavior. The scanner's summary counters ("Profitable OOS", "Beat buy & hold OOS") exist to force this reading.
- →Fewer, better trades. Compared with the plain Donchian breakout scan, Trend Ignition fires far less often — the ER and RV filters reject most raw breakouts. The trade-count column makes the trade-off explicit: you are buying signal quality with signal frequency.
- →Honest failure modes. On coins with structurally thin volume, RV is noisy and the filter mostly adds lag. On regime flips — a whole market rolling over together — a conviction filter does not save you; the dual exit does the damage control. The scan shows both plainly.
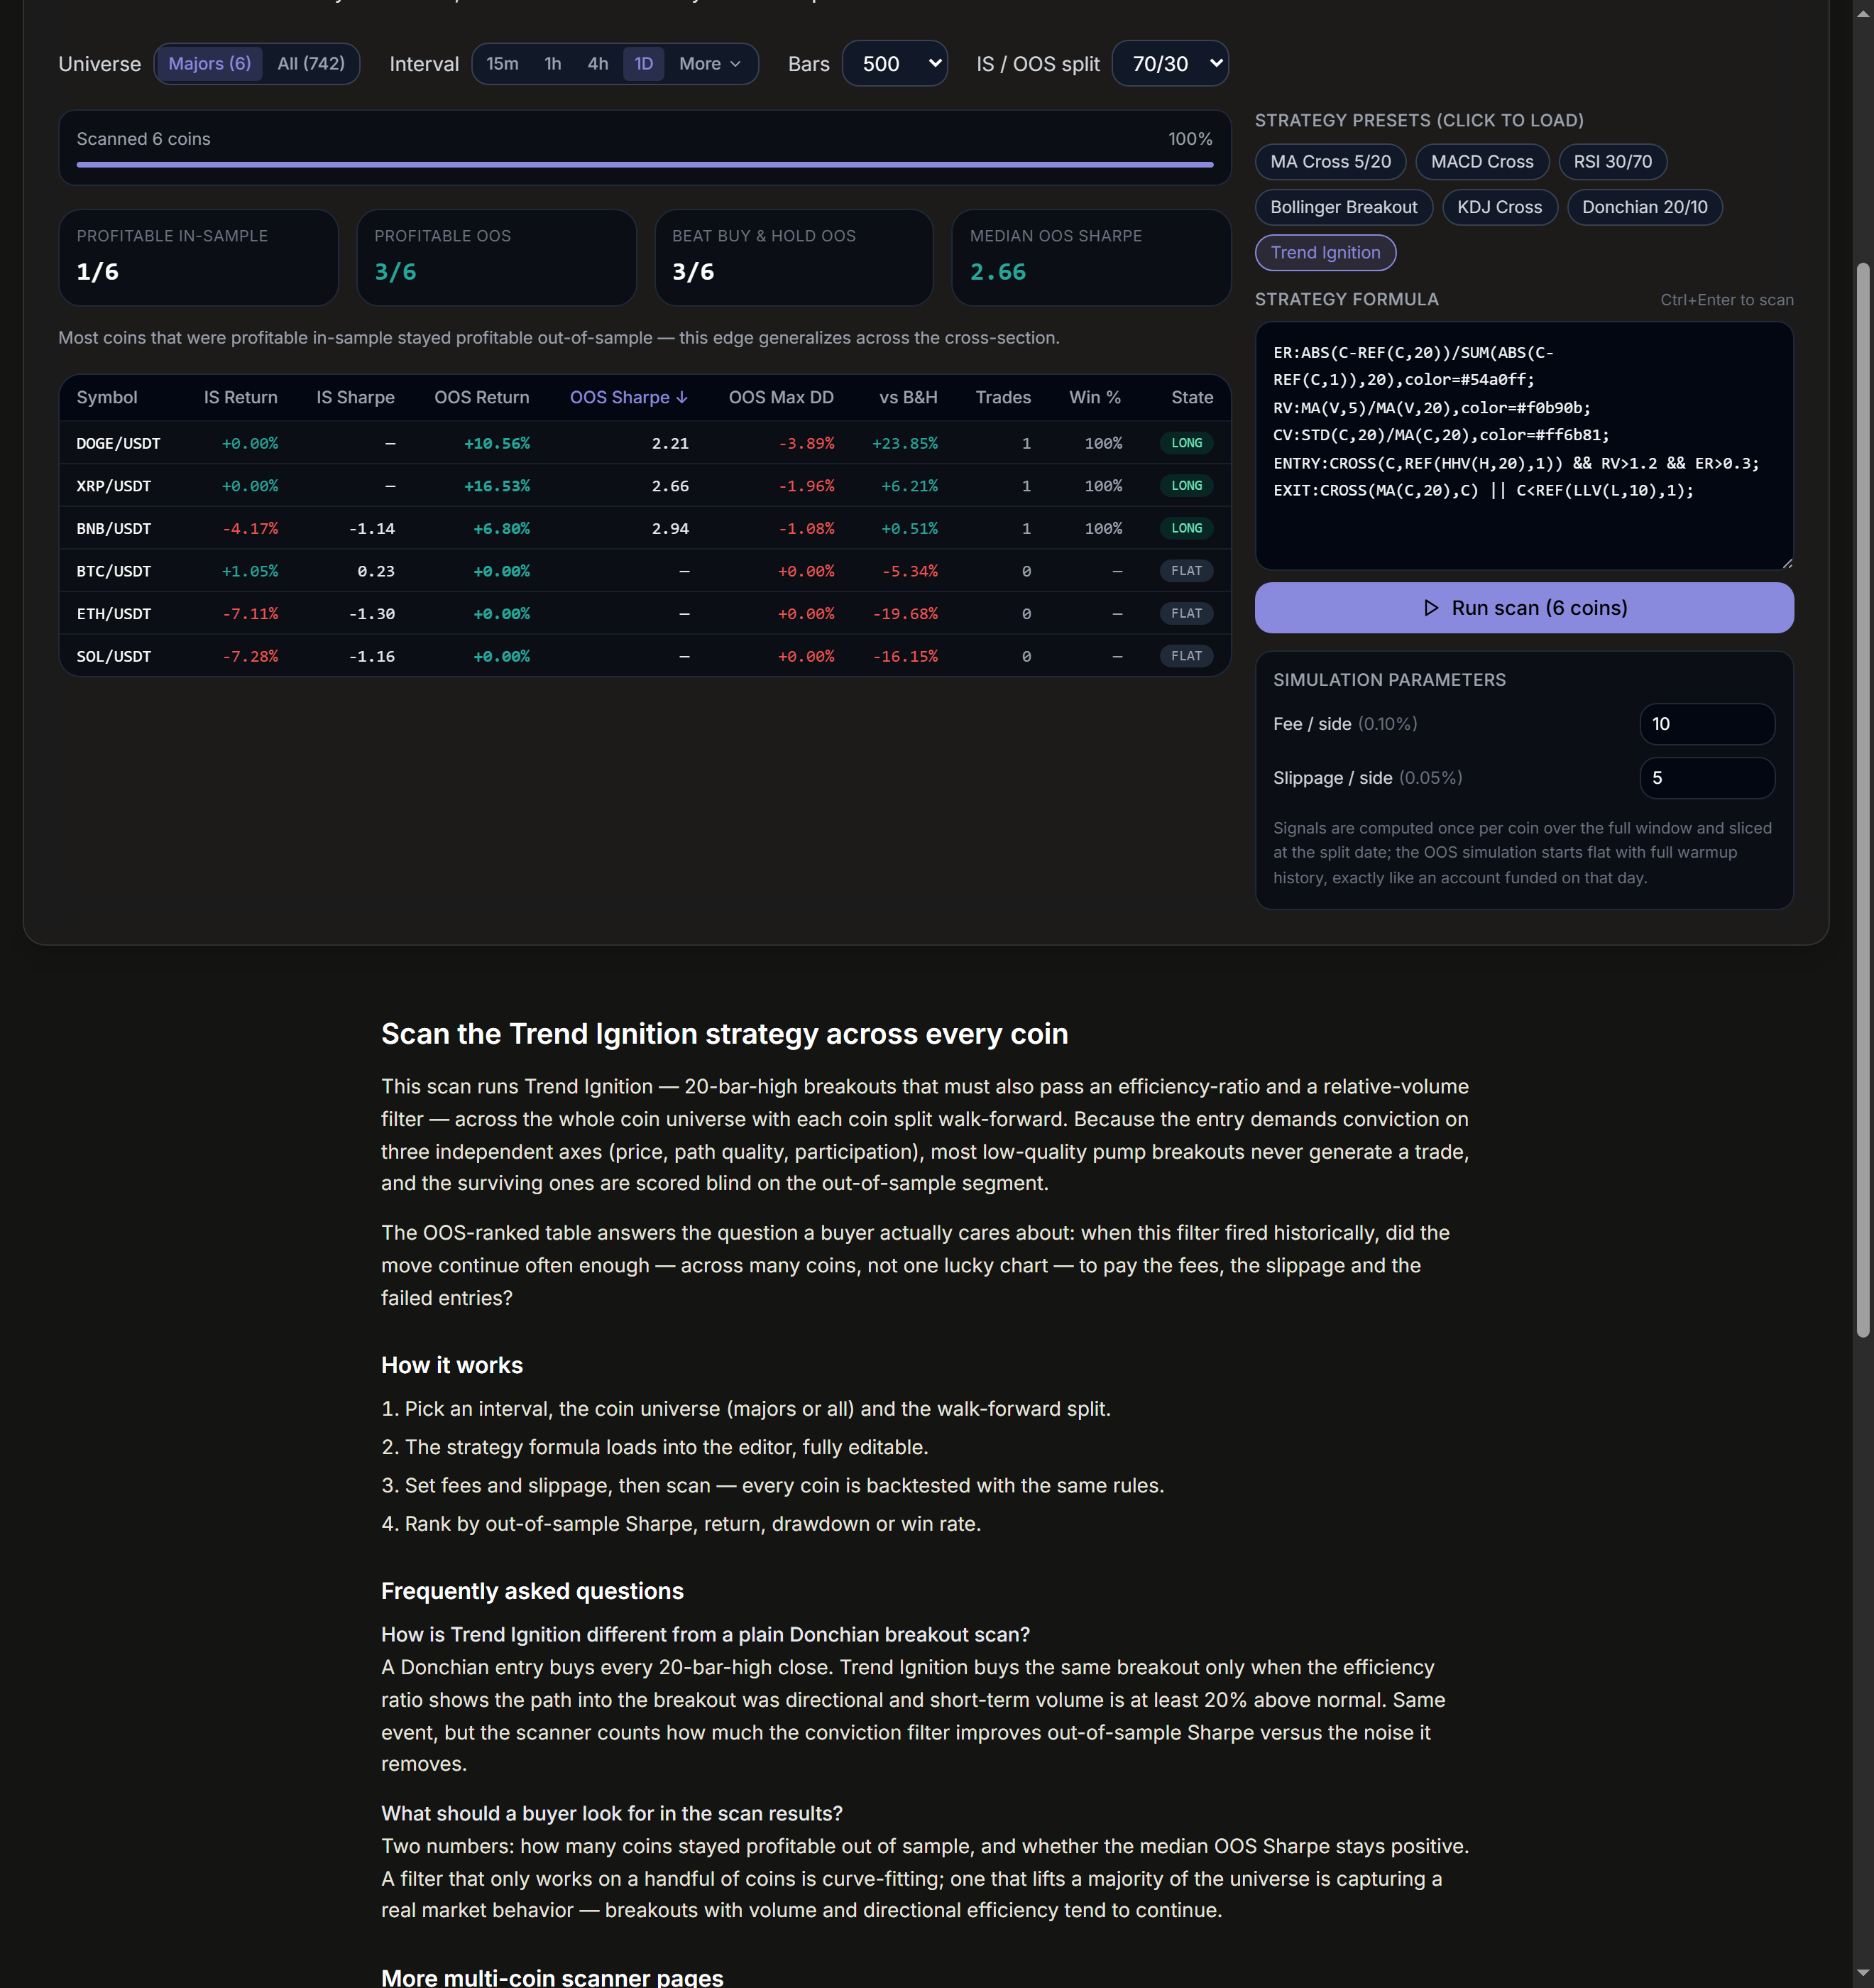
Two caveats we refuse to hide: today's coin list is itself a survivorship filter (dead coins are not on the menu), and past walk-forward results do not guarantee future ones. The scan measures history honestly; it cannot measure tomorrow.
🛒 What It Is Actually Good For as a Buyer
Practically, Trend Ignition is useful to three kinds of crypto users:
- →Breakout buyers get a pre-flight checklist encoded in one signal: is the path directional (ER), is there real participation (RV), and did price actually clear the prior high? If any answer is no, the "breaking news" breakout is noise by construction.
- →Swing traders get an exit discipline for free — the MA20 / 10-bar-low dual stop — instead of the emotional default of holding a failed breakout "because it will come back."
- →Long-term holders can invert it: coins flashing ignition entries are where trend-following add-ons have historically made sense, and the scan table doubles as a market-wide regime gauge — many simultaneous ignitions means a broad risk-on regime, none means the opposite.
The most valuable output is not even the individual signal. It is the scan: one formula, run across hundreds of coins, ranked by out-of-sample Sharpe. That turns "should I buy this breakout?" from a per-coin emotional decision into a portfolio-level statistical question — which is the only frame in which breakouts have ever paid.
Try It Yourself
- →Scan Trend Ignition across every coin — walk-forward, ranked by OOS Sharpe, fully editable.
- →Backtest it on a single pair with your own fees, slippage and intervals.
- →Compare against the raw Donchian and Bollinger breakout scans to see exactly what the conviction filters add — and what they cost.
Frequently Asked Questions
Why 0.3 for the efficiency ratio threshold?
ER above roughly 0.3 historically separates directional paths from chop across crypto intervals; below that, the "trend" into the breakout is mostly noise. It is deliberately modest — the filter's job is to exclude garbage, not to demand perfection, which would leave almost no trades.
Can't whales fake the volume filter?
On any single candle, yes — wash volume exists, especially on smaller exchanges. That is why RV compares 5-bar average to 20-bar average: faking sustained expansion for five bars is expensive, while faking one spike is cheap. It raises the cost of manipulation, it does not eliminate it.
Is Trend Ignition profitable?
It depends on the coin, interval, fee regime and market regime — which is why we do not quote a headline number. Run the scan and sort by out-of-sample Sharpe: the results, and their dispersion across coins, are the honest answer. No indicator is profitable in all regimes; this one is designed to lose small when wrong and participate fully when a real trend ignites.
Can I modify it?
Yes — that is the point of shipping it as DSL source. Tighten RV to 2.0 on majors, drop the volume clause for exchange-volume skeptics, switch the exit to a chandelier stop. The scanner re-runs your exact edited program across every coin, so you can test your variant walk-forward in seconds.
Trend Ignition is a research and screening tool, not investment advice. Breakout strategies carry risk of loss, walk-forward results do not guarantee future performance, and crypto markets can remain irrational longer than any filter stays solvent. Never risk more than you can afford to lose.