
⚡ TL;DR
- →Any strategy with a number in it — an RSI period, a volume multiple, a window length — can be tuned until its backtest looks brilliant. Most of that brilliance is parameter luck, and it evaporates the moment you trade it.
- →The Multi-Coin Scanner now has a Sensitivity Sweep button: it re-runs the entire walk-forward scan across up to five values of each parameter (holding the others fixed) and reports the median out-of-sample Sharpe per value as a colored strip.
- →A robust edge shows a plateau — profitable across a neighborhood of settings. A curve-fit shows a lonely peak — one green cell in a row of red. The sweep makes that difference visible before you risk a cent.
- →Try it now on any of the parameterized strategies — Trend Ignition, Capitulation Reversal or Net Flow Trend — it runs in your browser, on real candles, for free.
The Problem: Every Backtest Is the Best-of-Many
Here is a thought experiment every quant learns the hard way. Take a strategy with one parameter — say an RSI period — and backtest it at every value from 5 to 50. You will nearly always find some value with a gorgeous equity curve. Not because the market rewards that exact number, but because with 45 dice rolls, one lands six-up. Publish that one number and you have published a coin flip wearing a suit.
The industry name for the cure is parameter sensitivity analysis: before trusting a parameter, check that the strategy still works at neighboring values. Edges live in regions of parameter space, not at points. An RSI rule that pays at 12, 14 and 16 is expressing something about mean reversion; one that pays only at 14 is expressing something about the specific historical window you tested on.
Sensitivity analysis is standard practice in institutional research — and almost nowhere in retail tooling, because it means running a backtest many times and aggregating the results honestly. That is exactly the kind of batch, cross-sectional computation our scanner was built for, so we shipped it as one button.
🎛️ What the Sweep Actually Does
Strategies on the scanner now declare their tunable parameters in the open — they are the NAME:=value; lines at the top of the formula. The Capitulation Reversal preset, for example, exposes three:
N:=14;    ← RSI period
TH:=32;   ← RSI oversold threshold
VM:=1.5;  ← minimum volume multiple
RSI14:RSI(C,N);
ENTRY:RSI14<TH && V>VM*MA(V,20) && C>(H+L)/2;
EXIT:RSI14>50 || C<REF(LLV(L,10),1);
You can edit any of them by hand in the formula, or with the numeric controls above the editor. The Sensitivity sweep button then does the batch work:
- →One parameter at a time. For each declared parameter it samples up to five evenly spaced values across the parameter's sensible range (N from 7 to 28, TH from 25 to 40, VM from 1.2 to 2.5), holding every other parameter at its current value.
- →Each value runs the full scan. Same universe, same interval, same fees, same walk-forward 70/30 split — a complete multi-coin backtest per value, in your browser, on real exchange candles.
- →One honest number per value. The strip shows the median out-of-sample Sharpe across all coins in the universe — the same statistic the main ranking is sorted by, deliberately out-of-sample so the sweep cannot be impressed by in-sample curve-fitting.
The result reads like a temperature strip: green cells are profitable (deeper green past +0.5), red cells negative, a dash means the value produced no trades at all. Hover any cell for how many coins stayed profitable out of sample.
📸 Real Output: Sweeping Capitulation Reversal
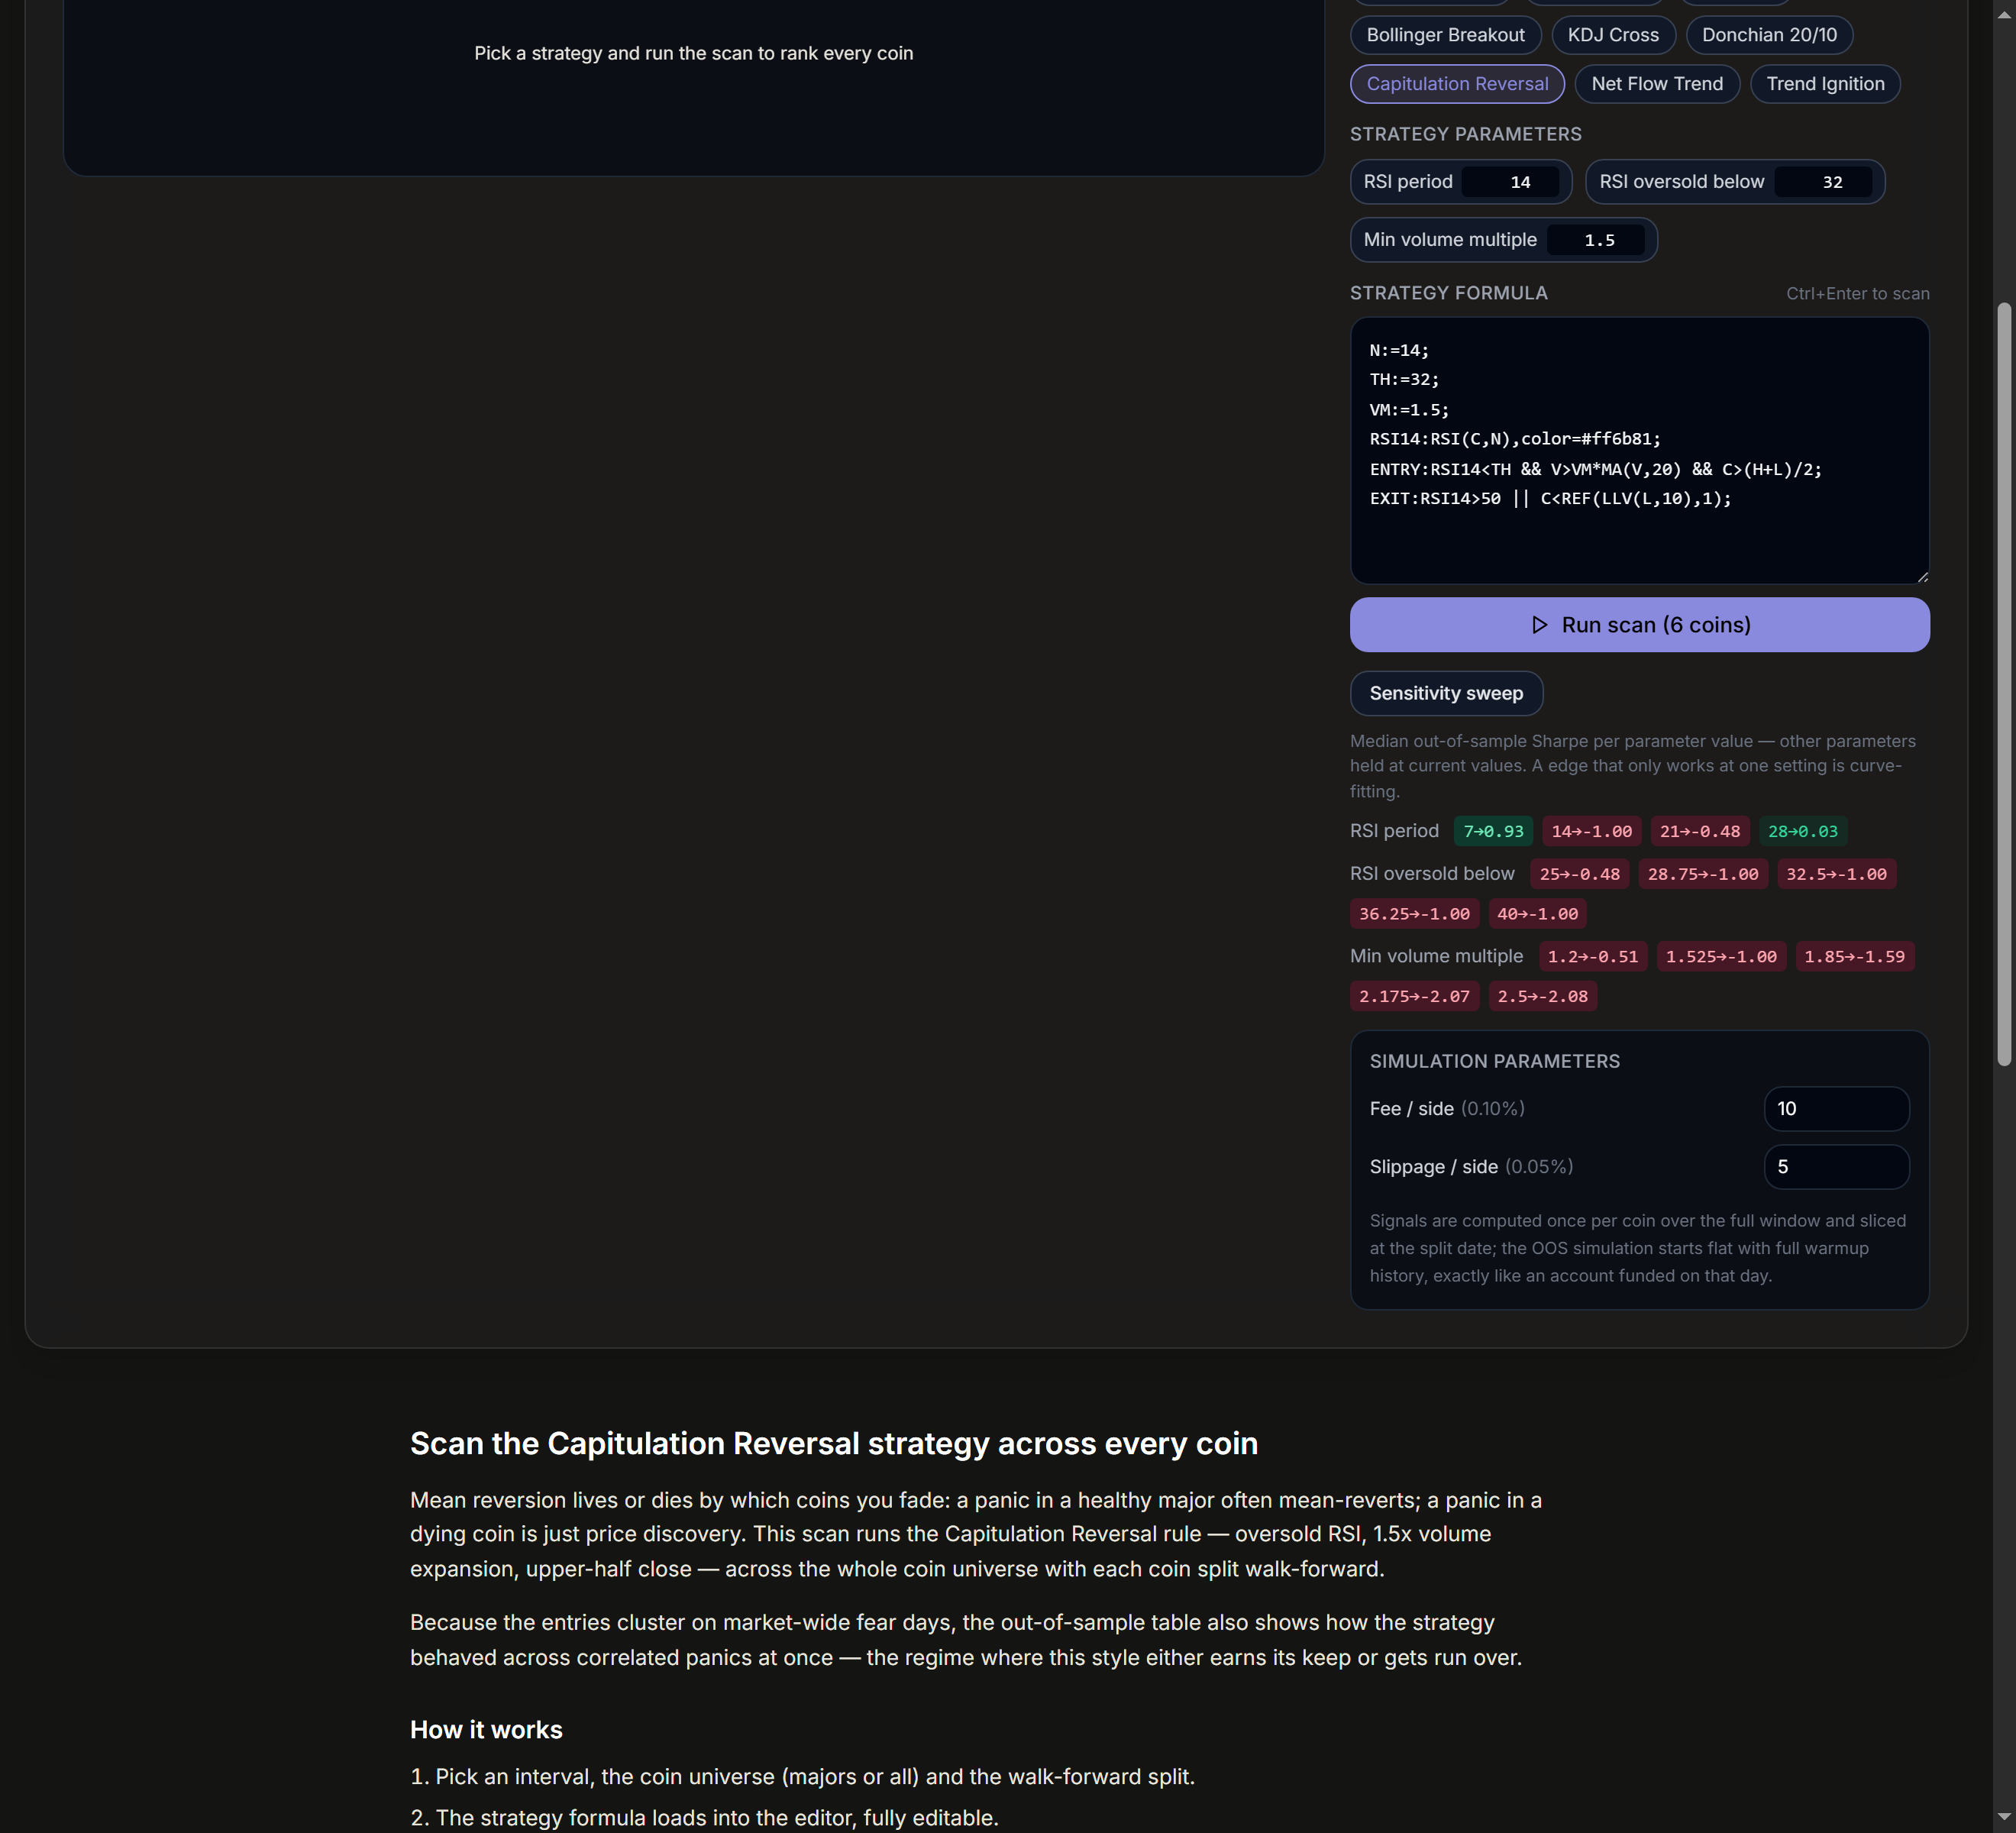
Read the strips honestly, because this real run is not flattering — which is precisely why it is worth showing:
- →RSI period (N): 7→+0.93, 14→−1.00, 21→−0.48, 28→+0.03. Green at the short end, red in the middle, flat at the long end. That is not a plateau; that is noise with structure — the strategy's performance depends on a period choice in a way the entry logic does not justify.
- →Oversold threshold (TH): 25→ no trades at all (too strict — the filter dies), best around 28–29, degrading monotonically to 40. A dead zone, then a slope: readable, but fragile.
- →Volume multiple (VM): flat around −0.5 for 1.2–1.85, then worse at 2.2–2.5. At least this one is stable — the volume gate is not where the luck lives.
The takeaway from this run: on this universe, interval and window, Capitulation Reversal's recent OOS results are parameter-fragile. That does not prove the panic-absorption idea is wrong — it proves this exact configuration owes part of its performance to where the dials sit. A buyer who knows that sizes the strategy differently than one who does not.
The Four Shapes a Sweep Can Take
The plateau
Green across a neighborhood of values, gentle slopes, no cliffs. The edge is a property of the market behavior, not the setting. This is what "robust" looks like; size accordingly.
The lonely peak
One green cell surrounded by red. That parameter value was fitted to history, not to the market. Either widen the plateau (change the mechanism, not the number) or discard the strategy.
The dead zone
A dash — no trades. Too strict to ever fire, like TH=25 above. A filter that never triggers is not conservative; it is absent. Loosen until the sample exists, then re-judge.
The monotone slope
Performance marching in one direction across the range. Sometimes real (a genuine regime preference), sometimes a trend hidden in the test window. Check the same sweep on a different interval before believing it.
⚖️ What the Sweep Does Not Do
Honest limits, in the same spirit as the tool:
- →One parameter at a time. Interactions are invisible: two parameters that are each harmless alone can be toxic together (and vice versa). Full grid search over all combinations is exponential and mostly teaches you new ways to overfit; start here.
- →Five points per range. Enough to see a plateau or a cliff, not enough to hunt for the exact optimum — deliberately. The sweep is a lie detector, not an optimizer.
- →It inherits the scanner's caveats. Survivorship bias in the coin list, one market window per run, exchange-reported volume. Re-run it on a different interval and universe before trusting any conclusion.
And the deepest one: a clean plateau raises your prior that an edge is real; it is never proof. The sweep kills bad strategies faster than it certifies good ones — which is exactly its job.
Using It Well: A Three-Minute Routine
- →Load a strategy on the scanner; set the universe, interval and split you actually trade.
- →Run the normal scan once — a strategy whose baseline is hopeless does not deserve a sensitivity analysis.
- →Hit Sensitivity sweep and read the strips: plateau = proceed with conviction; lonely peak or dead zone = fix or discard; slope = re-check on another interval.
- →Re-run the whole routine after major regime changes. A plateau in a bull window can be a peak in a bear one.
Frequently Asked Questions
Why median OOS Sharpe and not total return?
The median ignores the one lucky coin that would dominate a total, and out-of-sample ignores everything the parameter could have been fitted to. Together they answer: "at this setting, did the typical coin, on unseen data, get paid for the risk?" — the least flattering honest aggregate we could find.
If a sweep shows a plateau, is the strategy safe to trade?
Safer, not safe. A plateau removes parameter luck from the list of explanations; market regime, survivorship bias and plain variance remain. Use it as one gate in a checklist, never as a green light.
Can I sweep my own custom strategy?
Yes, if it uses the parameter convention: declare your numbers as NAME:=value; lines at the top of the formula (the built-in strategies all do). The sweep finds those lines and offers controls and sweeps automatically — edit the formula to add or rename them.
Why only five values per parameter?
Five honest full-scans per parameter is a few seconds of local compute and enough resolution to distinguish a plateau from a spike. A finer grid mostly manufactures false precision — the exact optimum of a noisy function is noise.
The Sensitivity Sweep is a research tool for evaluating strategy robustness, not investment advice. A favorable sweep does not guarantee future performance; an unfavorable one is usually telling you something worth hearing. Never risk more than you can afford to lose.