
⚡ TL;DR
- →Most "buy the dip" advice loses money because it buys any dip. A dip is only buyable when the selling has climaxed — and a climax leaves a fingerprint price alone cannot fake.
- →We built Capitulation Reversal: a mean-reversion entry that requires RSI below 32, volume at least 50% above normal (forced sellers exhausting), and a close in the upper half of the bar (buyers absorbing the flood) — all on the same closed bar.
- →It is the mirror image of our breakout strategy Trend Ignition: that one refuses to chase strength; this one refuses to catch knives. Together they cover both halves of the fear-greed cycle.
- →The formula is five lines of the same DSL our scanner runs — scan it across every coin walk-forward and see where panic-buying actually paid.
The Problem: "Buy the Dip" Without a Dip-Test
Crypto Twitter's most expensive advice is also its most popular: buy the dip. The problem is that a dip is only a discount in hindsight. Half of all dips are the first half of a crash, and the buyer who averages down through one pays for the lesson with a 70% drawdown.
What separates a buyable dip from a falling knife? Not price — price looks identical at the start of both. What differs is the behavior around the low: a buyable bottom is a violent, high-volume event where forced sellers finally transact with waiting buyers. A knife is a quiet drift lower where no one has yet stepped up. Classic RSI below 30 cannot tell these apart; it fires on both.
So we set out to encode what a real selling climax looks like — and to refuse every dip that does not look like one.
🩸 The Design: Three Signatures of a Selling Climax
1. Stretch — RSI below 32
The classic overbought/oversold oscillator, computed our engine's way: SMA(MAX(C-LC,0),14,1)/SMA(ABS(C-LC),14,1)*100 where LC is the prior close. Below 32 the market is statistically stretched to the downside — a precondition, never a trigger. (Why 32 and not the textbook 30? Measured frequency: on daily majors, RSI<30 with the other two filters fired almost never. 32 keeps the signal alive — the honest calibration story is below.)
2. Exhaustion — volume 50% above normal
Climaxes are volume events: margin calls, forced liquidations, capitulating holders — everyone who wanted out, out at once. The entry requires V > 1.5 × MA(V,20): this bar traded at least 50% more than the recent norm. A quiet drift to oversold fails this check and is skipped — exactly the knife we want nothing to do with.
3. Absorption — close in the upper half of the bar
The final and most important signature: C > (H+L)/2. On the scariest bar of the decline, with volume screaming, price recovered to close in the upper half of its range. That means real size sat under the market and absorbed the flood — sellers exhausted into willing buyers. An equally ugly bar that closes on its lows has no buyer in it yet; it is not a bottom, it is a waypoint.
All three must be true on the same closed bar. One candle can fake price; it cannot fake a month of RSI history, a volume surge, and absorption all at once.
📜 The Formula
LC:=REF(C,1);
RSI14:SMA(MAX(C-LC,0),14,1)/SMA(ABS(C-LC),14,1)*100,color=#ff6b81;
ENTRY:RSI14<32 && V>1.5*MA(V,20) && C>(H+L)/2;
EXIT:RSI14>50 || C<REF(LLV(L,10),1);
- →LC/RSI14 — the 14-period RSI, built from the engine's SMA primitive (our DSL has no built-in RSI — this is the same formula the Indicator Lab draws, shown in full because nothing here is a black box).
- →ENTRY — stretch + exhaustion + absorption on one bar, as above.
- →EXIT — two ways out: RSI back above 50 (the market normalized; the panic premium is gone) or a close below the prior 10-bar low (the low was not THE low; the thesis failed, cut it).
No hidden parameters, no curve-fit constants beyond what the calibration section admits. Edit any threshold in the scanner and rescan — the tool is a hypothesis, not a product.
🔬 The Calibration: What 1,000 Bars of Real Data Taught Us
Our first draft used the textbook numbers: RSI<30 with volume at 2× the 20-bar average. On real daily candles it produced zero entries on BTC and DOGE over 1,000 bars, one on ETH — the same dead-filter lesson as our breakout indicator's first volume gate. Three simultaneous conditions squeeze the probability space hard; each must be loose enough that the intersection still breathes.
Relaxing to RSI<32 and 1.5× volume yielded 11 entries on BTC, 16 on ETH, 9 on SOL per 1,000 daily bars — roughly one buyable climax per coin every two to three months. That is the natural frequency of true panic in liquid majors: rare, which is the point. A mean-reversion signal that fires weekly is not finding climaxes; it is finding ordinary weakness.
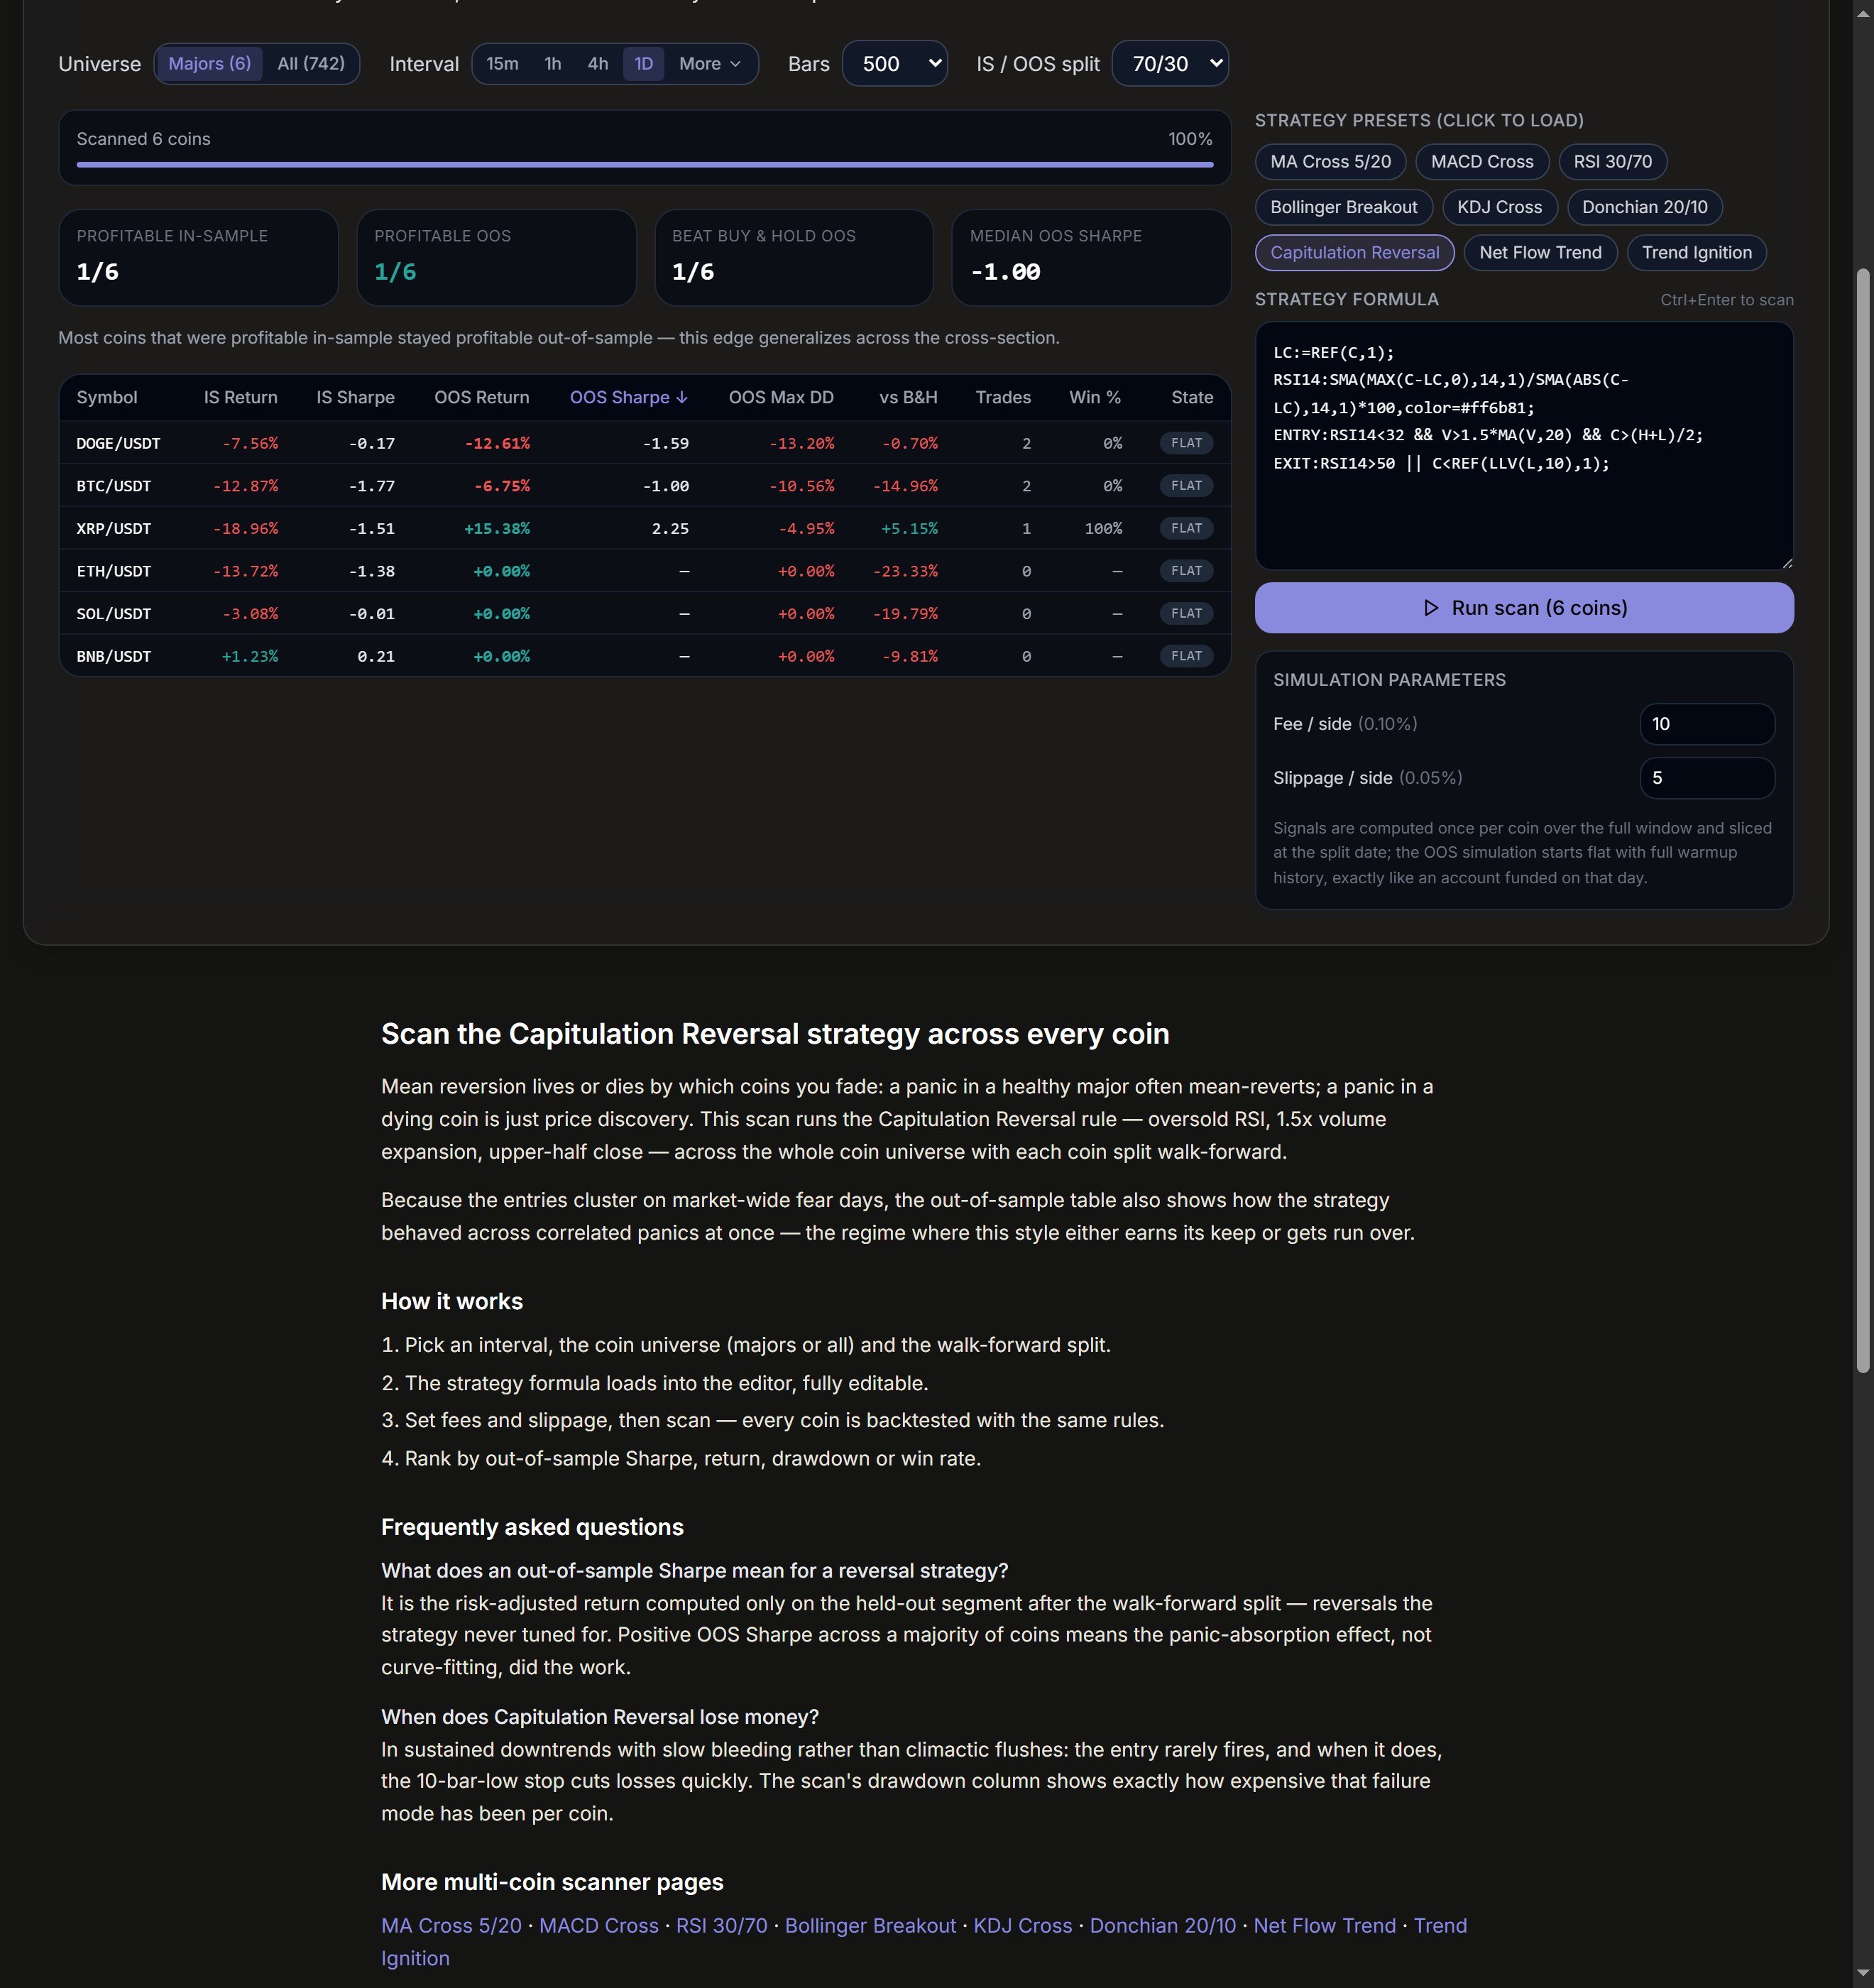
Validation follows the same walk-forward discipline as everything on the scanner: each coin's history is split 70/30, the in-sample segment would have been used for discovery, and the out-of-sample segment is scored blind. For a reversal strategy the OOS table answers the question that matters: when this fingerprint fired on data the parameters never saw, did the snap-back actually pay?
Two honest caveats. Reversal entries cluster on market-wide fear days, so a good quarter and a bad quarter are both correlated across coins — diversification across the universe does not diversify the regime. And capitation in a structurally dying coin is not panic, it is price discovery; the 10-bar stop is what keeps that lesson cheap.
🛒 What It Is Good For as a Buyer
- →Dip buyers get a mechanical dip-test: no stretch, no exhaustion, no absorption — no buy. It converts the most emotional trade in crypto into a checklist.
- →Long-term holders get a rule for adding on weakness: the scan table shows which coins actually reward panic-buying out of sample — and which keep bleeding through every climax.
- →Everyone gets the other half of the cycle: pair it with Trend Ignition (breakout with conviction) and you hold a systematic answer to both extremes of sentiment — buy fear when it climaxes, buy greed when it ignites, stand aside between.
Frequently Asked Questions
Why buy a crash instead of waiting for confirmation?
Because the absorption close IS the confirmation — the bar closed strong on climax volume. Waiting another bar for a trend signal gives back the panic premium, which is most of the edge. The trade-off is a harder stop: the 10-bar low, hit quickly when the climax was a waypoint.
Is the upper-half close rule the same as a hammer candle?
Related but stricter on context and looser on shape. A hammer needs a specific wink of the wick; absorption only needs the close in the upper half of the range — but it must coincide with oversold RSI and a volume spike, which hammer definitions never require.
Does this work on smaller altcoins?
Run the scan and sort by OOS Sharpe — that is the honest answer, per coin. Thin alts fake the volume signature more easily and their panics are often real declines; the cross-section table exists precisely so you can see where the effect holds and where it does not.
Capitulation Reversal is a research and screening tool, not investment advice. Mean-reversion strategies carry the risk that any single panic is the start of a larger decline; walk-forward results do not guarantee future performance. Never risk more than you can afford to lose.