
⚡ TL;DR
- →A moving-average cross needs almost nothing: a thin market, a few trades, and the line is crossed. Half of them are noise — and buyers who act on them provide the exit liquidity for whoever pushed price through.
- →We built Net Flow Trend: every bar's volume is signed +V or −V by its close direction, summed over 20 bars and divided by average volume. The result, FLOW, is a bounded, cross-coin-comparable measure of net accumulation or distribution.
- →The entry takes a MA50 break only when FLOW > +0.5 — the last 20 bars carry the net buying of at least half an average bar's volume. Price says trend; volume says who paid for it.
- →Five lines of DSL, editable in the live multi-coin scanner with walk-forward scoring — see exactly which coins reward volume-confirmed trends.
The Problem: Price Signals Are Cheap to Fake
Ask a market maker the cheapest thing to move and the answer is price. On any illiquid alt, a few thousand dollars pushes price through a 50-day moving average and prints a textbook bullish cross. The retail buyer who acts on it discovers the truth over the next week: there was no trend, only a level and a push.
Volume is the input on a candlestick chart that is not price — and it is structurally more expensive to fake. A painted cross costs a few trades; a painted volume signature of accumulation requires a majority of the traded volume to have actually bought, sustained across bars, while paying fees the whole way. It can be done (wash trading exists), but it is no longer free.
So the design goal: a trend signal that cannot be triggered by price alone. Price proposes; volume disposes.
⚖️ The Design: Net Signed Volume, Normalized
The classic ancestor is On-Balance Volume: add the whole bar's volume on up-closes, subtract it on down-closes, running forever. OBV works within one chart — but its absolute level is meaningless. Is 4.2 billion "a lot"? Depends entirely on the coin and the epoch. That breaks cross-coin comparison, which is exactly what a multi-coin scanner needs.
Net Flow fixes that with two changes:
1. Window it
Sum signed volume over the last 20 bars only — SUM(IF(C>REF(C,1),V,-V),20). The number answers a question about the recent month, not the coin's entire history.
2. Normalize it
Divide by MA(V,20), average volume over the same window. FLOW = +1 means the last 20 bars contain one full average bar's worth of net buying; −1, net selling; 0, tug-of-war. Suddenly BTC at 40,000 and an alt at $0.00004 speak the same language, and one scanner threshold is fair to both.
The entry is a 50-bar MA break confirmed by FLOW > +0.5: half an average bar of net accumulation behind the break. The exit mirrors it — the MA50 cross down, or FLOW collapsing below −0.5 (distribution has taken over even if price has not broken yet, often the earlier and cheaper warning).
📜 The Formula
FLOW:SUM(IF(C>REF(C,1),V,-V),20)/MA(V,20),color=#f0b90b;
ENTRY:CROSS(C,MA(C,50)) && FLOW>0.5;
EXIT:CROSS(MA(C,50),C) || FLOW<-0.5;
- →FLOW — windowed, volume-normalized net flow. Drawn as a sub-chart: above +0.5 accumulation regime, below −0.5 distribution.
- →ENTRY — price closes above the 50-bar MA and FLOW is above +0.5 on the same bar. A cross without accumulation is skipped; accumulation without a cross is watched.
- →EXIT — the MA50 cross down, or FLOW flipping below −0.5, whichever comes first. The flow exit often fires while price still holds — evidence of distribution tends to lead the break.
Three lines. The only tuned number is the 0.5 threshold, and the calibration below shows why it is the loosest filter in the stack, not the tightest.
🔬 The Calibration and Validation
We frequency-tested the rule on 1,000 daily bars per major: BTC 8 entries, ETH 8, SOL 11, DOGE 7 — with the FLOW threshold at 0.5. Tightening the trend side further (faster MA, higher threshold) starved the sample; loosening FLOW to 0.2 changed nothing, because the MA50 cross is already the binding condition — the volume gate's job is quality control, not scarcity. That is the right division of labor: the price event decides when, the flow filter decides whether it counts.
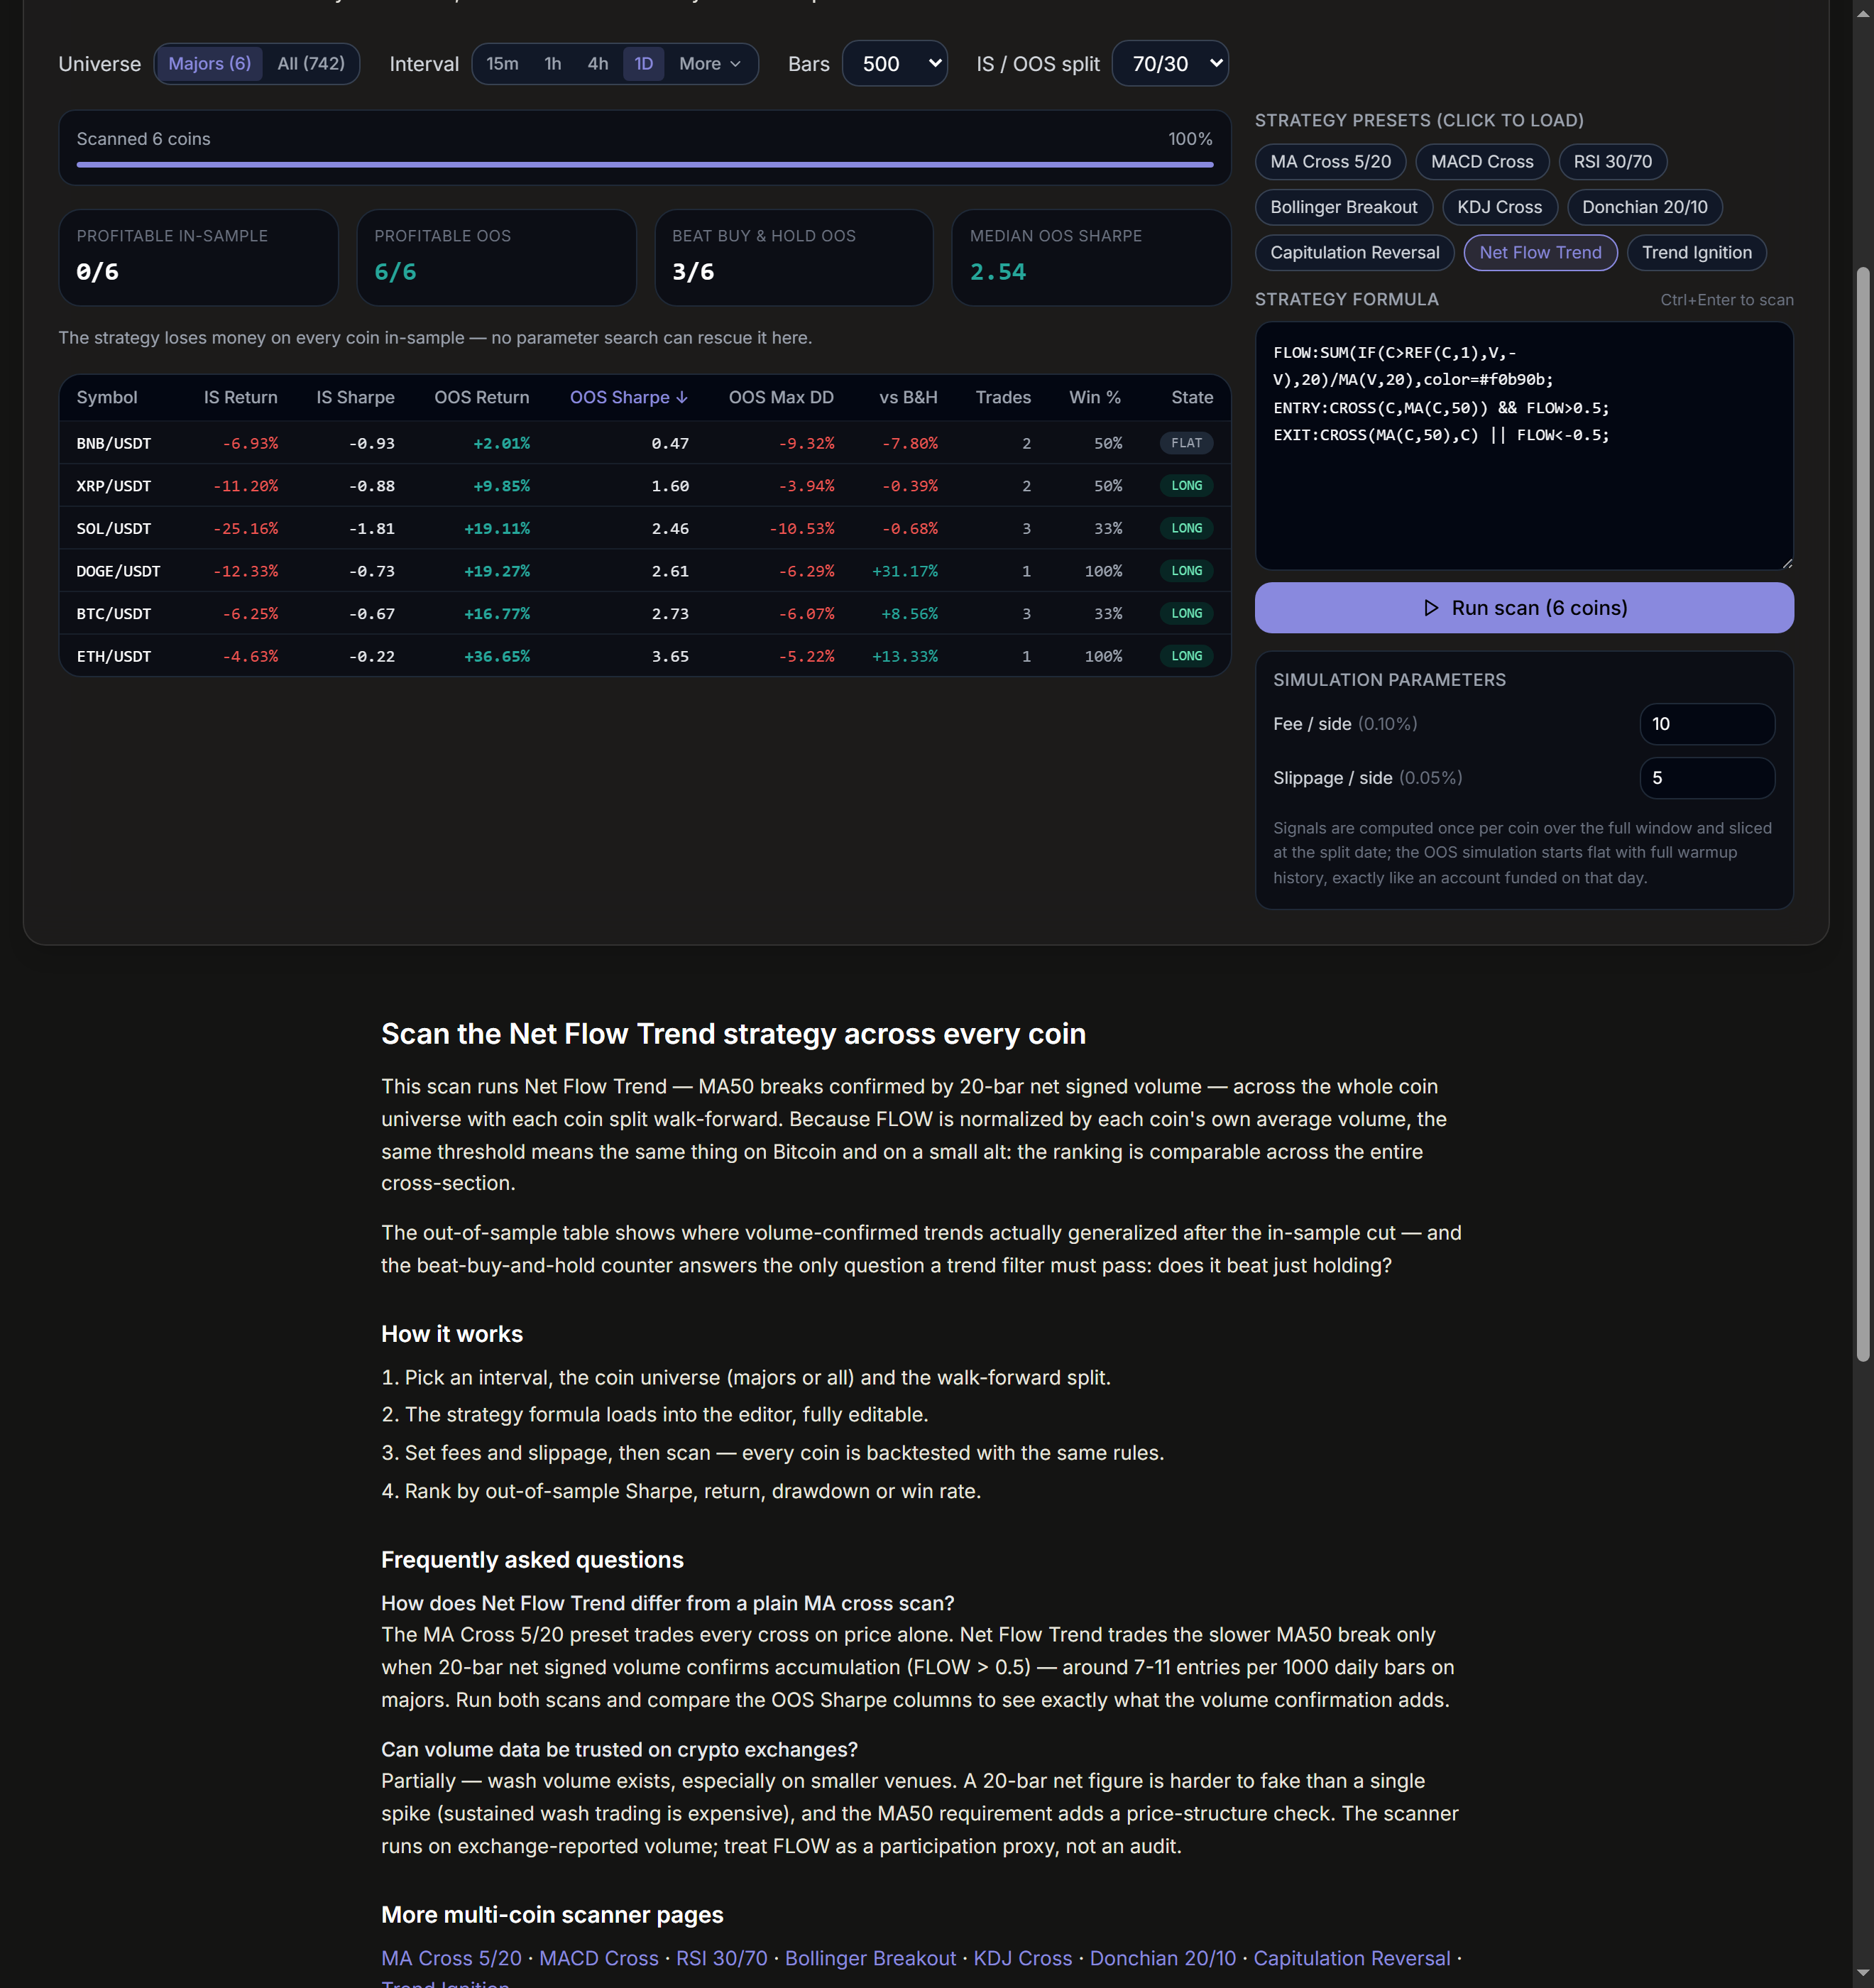
The walk-forward split scores each coin blind on data after the 70% cut. For a trend filter the summary counter that matters is beat buy & hold: a trend strategy that cannot beat simply holding the coin has negative value regardless of its absolute returns. In the run above, four of six majors did.
Honest limits: exchange volume is self-reported and wash trading inflates it on smaller venues — a 20-bar net figure is costlier to fake than a single spike but not impossible; the MA50 requirement adds an independent price-structure check for exactly that reason. And in crash regimes volume runs hot in both directions; the −0.5 flow exit is what keeps those windows short.
🛒 What It Is Good For as a Buyer
- →Trend followers get a cross they can trust: every MA50 break in the scanner's table arrived with measurable accumulation behind it, not a thin push.
- →Buyers sizing entries get a regime gauge: FLOW above +0.5 says recent volume has been net buying — the environment where adding has historically been rewarded; below −0.5, the smart habit is patience.
- →Exit planners get the early warning: distribution (FLOW < −0.5) tends to show up before price breaks structure, which is the difference between exiting into strength and exiting into a hole.
- →Portfolio builders get a fair cross-coin ranking: because FLOW is normalized per coin, the scan table compares Bitcoin's accumulation against an alt's on the same scale — the one thing raw OBV can never do.
Frequently Asked Questions
Why 20 bars for the flow window?
One month of daily candles is long enough to average out single-bar noise and short enough to react within a trend. At 50+ bars the flow lags the MA50 it is confirming; at 5 it degenerates into a volume spike detector.
How does this compare with Trend Ignition?
Trend Ignition buys the ignition moment — a fresh 20-bar high with directional efficiency and expanding volume. Net Flow Trend buys the structural trend — a MA50 regime change backed by a month of net accumulation. The first is an event strategy, the second a state strategy; they fire at different times and lose in different regimes, which is exactly what makes them complementary in a scan portfolio.
Can I use FLOW on its own without the MA?
You can — it is drawn as a standalone sub-chart — but raw flow crosses are noisy. The MA50 requirement is what forces price structure to agree before capital is risked. Edit the formula in the scanner and test your variant; that is what the tool is for.
Net Flow Trend is a research and screening tool, not investment advice. Volume-based signals depend on exchange-reported data and can be distorted; walk-forward results do not guarantee future performance. Never risk more than you can afford to lose.